George Foreman passed away in late March, bringing his story into mainstream news. If you spend any time reading about his life, the following term will come up, a term that serves as an interesting metaphor for the financial markets today.
-
Assume a defensive stance, keep your guard up = Diversification
-
Most asset classes are up year-to-date
-
Most sectors of the S&P 500 are up year-to-date
-
Continuing the sports analogy, diversified portfolios are winning this year, they did not win last year.
-
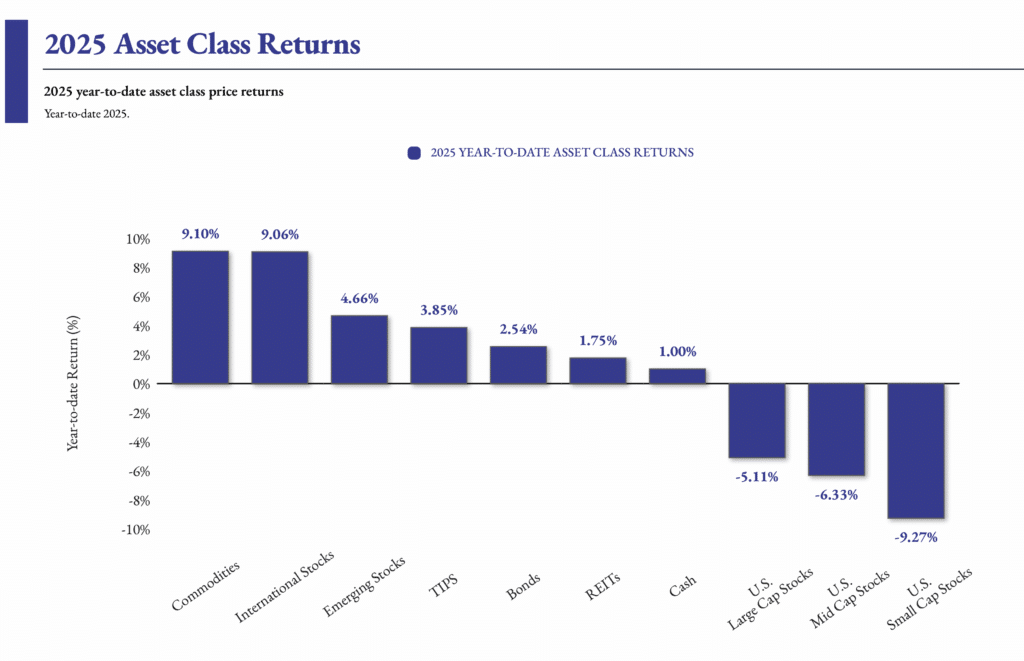
Source: © Exhibit A, FactSet Research Systems Inc., Standard & Poor’s | Latest: 2025-03-28
This slide is for informational and illustrative purposes only. The data provided is believed to be accurate, but there is no guarantee of its accuracy, completeness, or timeliness. This is not a recommendation or oer of any nancial product. Past performance is not indicative of future results, and investors should
consider their own objectives and risk tolerance. Indices, if presented, do not include fees, are unmanaged, and not available for direct investment. Denitions & Methodology: The returns shown represent year-to-date price performance of sector ETFs provided by iShares (EEM, EFA, TIP, AGG, DJP), SPDR
(VNQ, MDY, SPSM, SPY, BIL), and Vanguard (VNQ). These ETFs track the following sectors: Commodities, International, Emerging Markets, U.S. Large Cap, REITs, U.S. Mid Cap, TIPS, U.S. Small Cap, Cash, and Bonds. Data is sorted by return from highest to lowest.
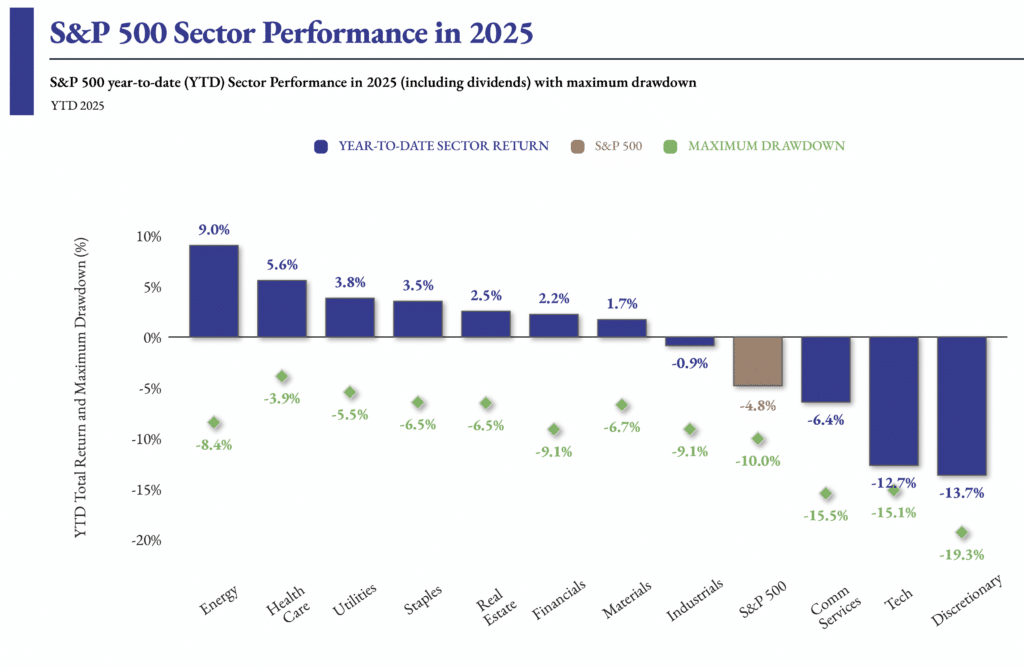
Source: © Exhibit A, FactSet Research Systems Inc., Standard & Poor’s | Latest: 2025-03-28
This slide is for informational and illustrative purposes only. The data provided is believed to be accurate, but there is no guarantee of its accuracy, completeness, or timeliness. This is not a recommendation or oer of any nancial product. Past performance is not indicative of future results, and investors should
consider their own objectives and risk tolerance. Indices, if presented, do not include fees, are unmanaged, and not available for direct investment. Denitions & Methodology: The S&P 500 tracks the performance of 500 large-cap U.S. companies, serving as a benchmark for the U.S. stock market. The index isweighted by market capitalization. The 11 S&P 500 Sectors represent the 11 distinct categories of companies within the S&P 500index, each reecting a specic area of the economy. The sectors are listed in the chart above along the x axis. Each sector groups companies with similar business activities. The chart showsthe S&P 500 and its sector index total returns year-to-date with maximum drawdowns as diamonds. Total returns include dividends. Dividends are payments made by companies to shareholders, typically from prots, as a return on investment. The chart is sorted highest to lowest by year-to-date return. The maximum drawdown measures the largest decline in the value of each sector index, calculated as the dierence between the peak and the trough within the year.
-
Counterpunch = Stick to the Plan and Rebalance as needed
-
Recessions, stock pullbacks, and volatility are normal and frequently provide opportunities to make new investments
-
Modern recessions tend to be shorter in duration and less frequent
-
Stock returns are random in the short term; this current pullback is relatively mild but deserves attention.
-
Volatility is normal; markets experience a 5% pullback or more almost every year.
-
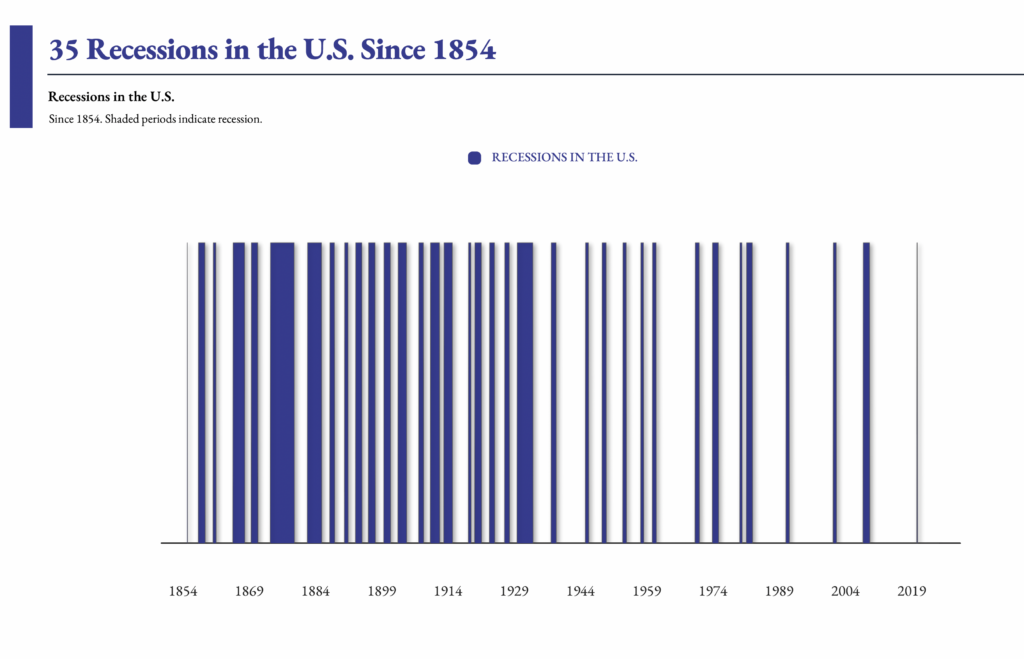
Source: © Exhibit A, Federal Reserve Bank of St. Louis via FRED | Latest: 2025-02-28
This slide is for informational and illustrative purposes only. The data provided is believed to be accurate, but there is no guarantee of its accuracy, completeness, or timeliness. This is not a recommendation or oer of any nancial product. Past performance is not indicative of future results, and investors should consider their own objectives and risk tolerance. Indices, if presented, do not include fees, are unmanaged, and not available for direct investment. Denitions & Methodology: Recessions, as dened by the National Bureau of Economic Research (NB ER), are periods of signicant economic decline lasting at least two consecutive quarters. They are characterized by widespread reductions in real GDP, employment, and other key economic indicators. The NB ER uses a range of data, including income and industrial production, to determine the start and end of a recession. This chart shows recessions (as shaded periods), as dened by the NB ER since 1854. It is meant to illustrate that recessions are a part of investing. There have been 35 since 1854.
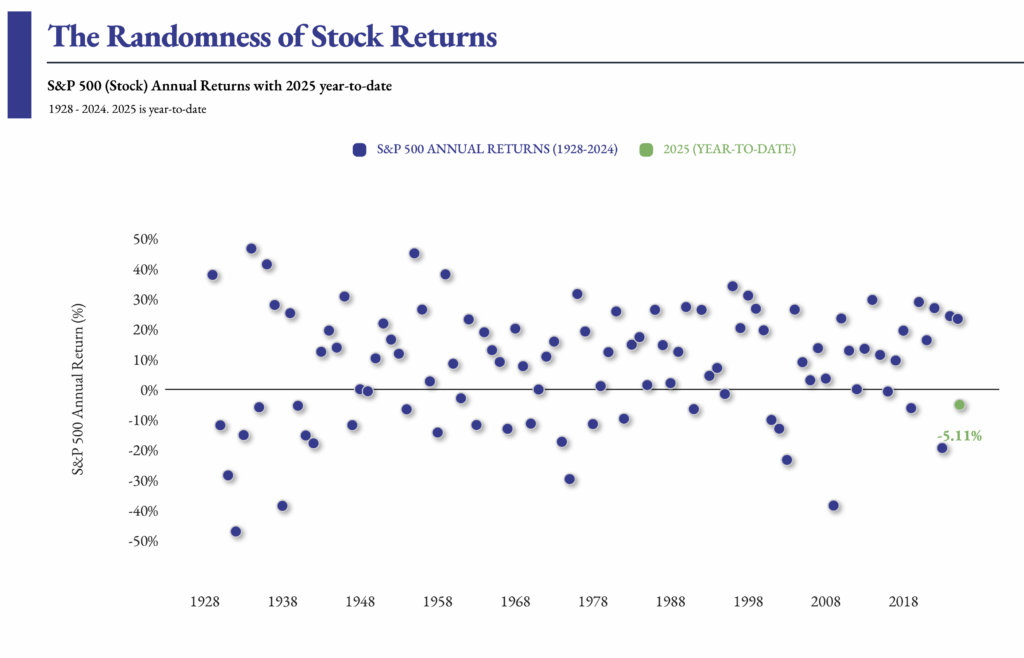
Source: © Exhibit A, FactSet Research Systems Inc., Standard & Poor’s | Latest: 2025-03-29
This slide is for informational and illustrative purposes only. The data provided is believed to be accurate, but there is no guarantee of its accuracy, completeness, or timeliness. This is not a recommendation or oer of any nancial product. Past performance is not indicative of future results, and investors should consider their own objectives and risk tolerance. Indices, if presented, do not include fees, are unmanaged, and not available for direct investment. Denitions & Methodology: The S&P 500 tracks the performance of 500 large-cap U.S. companies, serving as a benchmark for the U.S. stock market. The index is weighted by market capitalization. The chart shows the annual price return of the S&P 500 in all years since 1928. It also shows the current year’s year-to-date price performance as a dierent color dot. The chart illustrates that there is an element of randomness to S&P 500 annual returns.
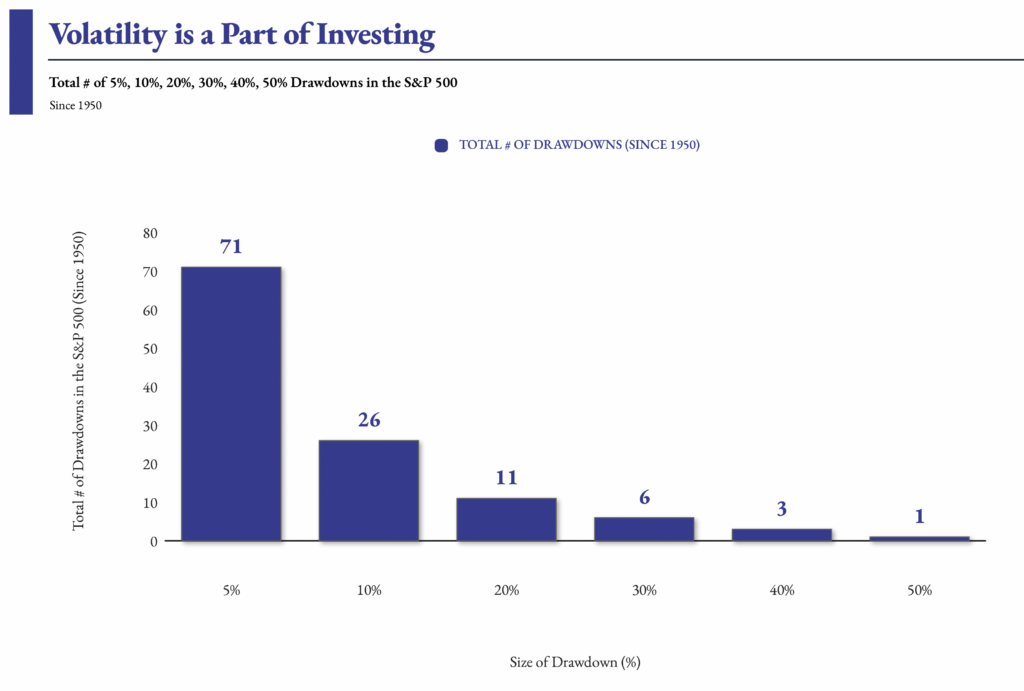
Source: © Exhibit A, FactSet Research Systems Inc., Standard & Poor’s | Latest: 2025-03-28
This slide is for informational and illustrative purposes only. The data provided is believed to be accurate, but there is no guarantee of its accuracy, completeness, or timeliness. This is not a recommendation or oer of any nancial product. Past performance is not indicative of future results, and investors should consider their own objectives and risk tolerance. Indices, if presented, do not include fees, are unmanaged, and not available for direct investment. Denitions & Methodology: The S&P 500 tracks the performance of 500 large-cap U.S. companies, serving as a benchmark for the U.S. stock market. The index is weighted by market capitalization. The chart shows the total number of 5%, 10%, 20%, 30%, 40%, and 50% drawdowns in the S&P 500 since 1950. Drawdowns are dened as the largest decline in the S&P 500, calculated as the dierence between the peak and the trough before the S&P 500 reaches a new high. Returns are price returns. The chart illustrates that while the S&P 500 over the long-term has positive returns, those returns have not come without a signicant amount of volatility.
Interesting side note: my adult children had no idea there was more to the story of George Foreman than a handy indoor grill. It is a good thing to learn something new every day!


